

The drill results, in 3D —
straight from the announcements.
Aurigrade turns raw ASX drill data into an interactive picture: hole traces in 3D over real terrain, live cross-sections, geology overlays and market data. Neutral, visual, and built for investors — not sell-side decks.
Map, drill holes and the source PDF — one workspace
A satellite map with every drill collar, click any hole for its intercepts, and the original ASX announcement opens alongside — every number traceable to the page it came from.
Open the viewer →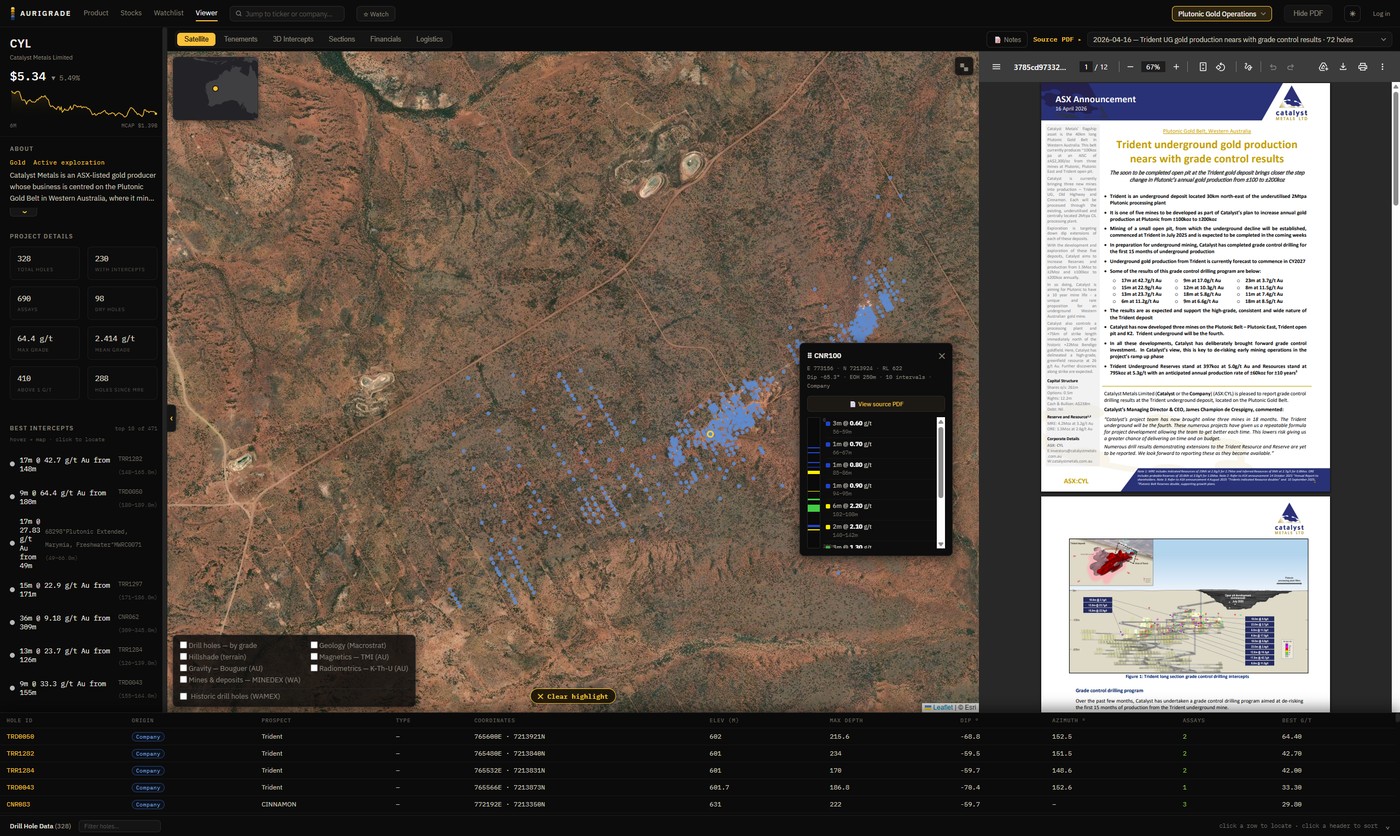
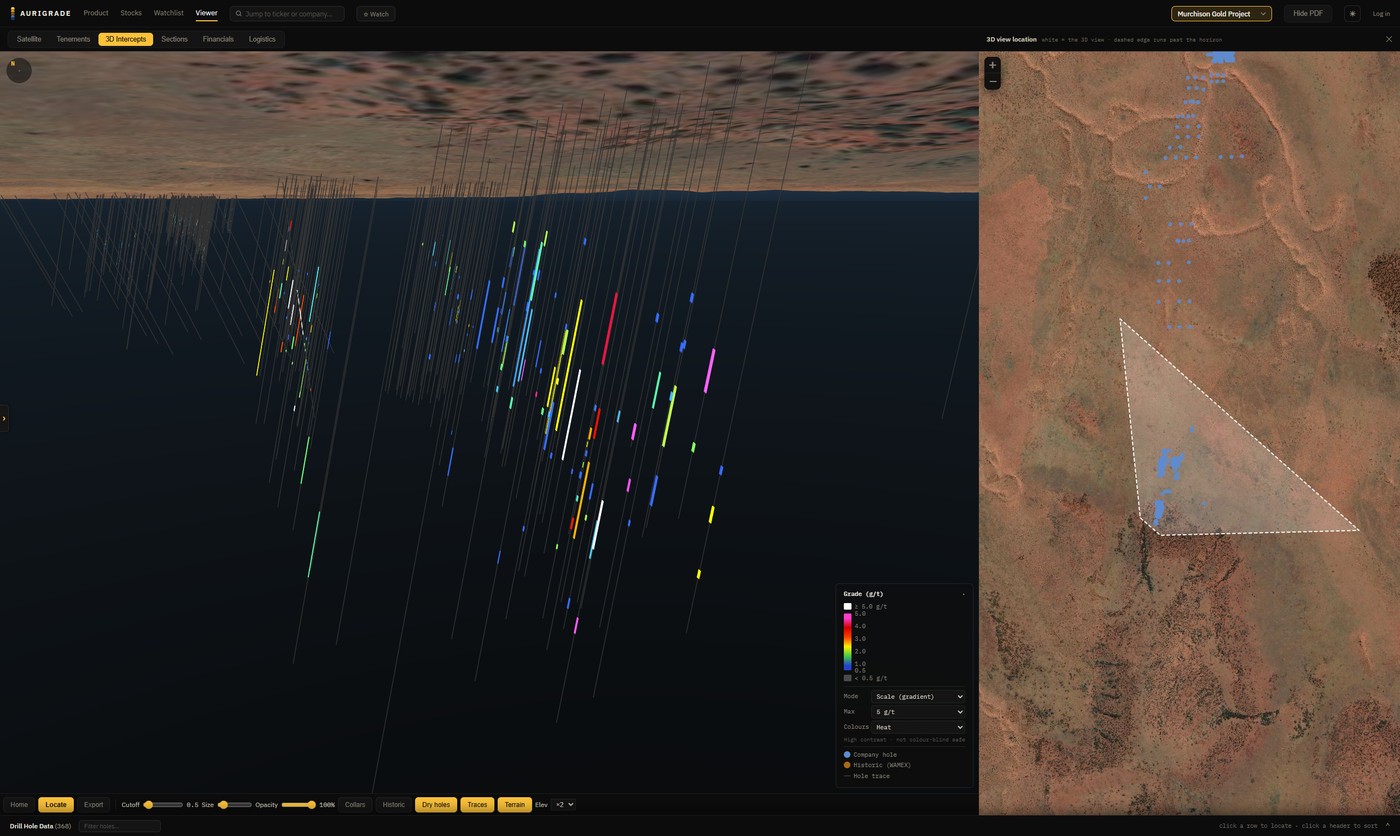
Every intercept in 3D, over real terrain
Drill holes render as grade-coloured cylinders beneath satellite-draped topography. Rotate the deposit, exaggerate the relief, filter by depth, hover any hit for its grade — the whole orebody, the way a geologist pictures it.
Open the 3D view →Slice the deposit — and never lose your place
Scrub through interactive cross-sections hole-by-hole, adjust the slice thickness, and read grade down every hole. A live locator map shows exactly where the section you're looking at sits on the ground.
Open the sections view →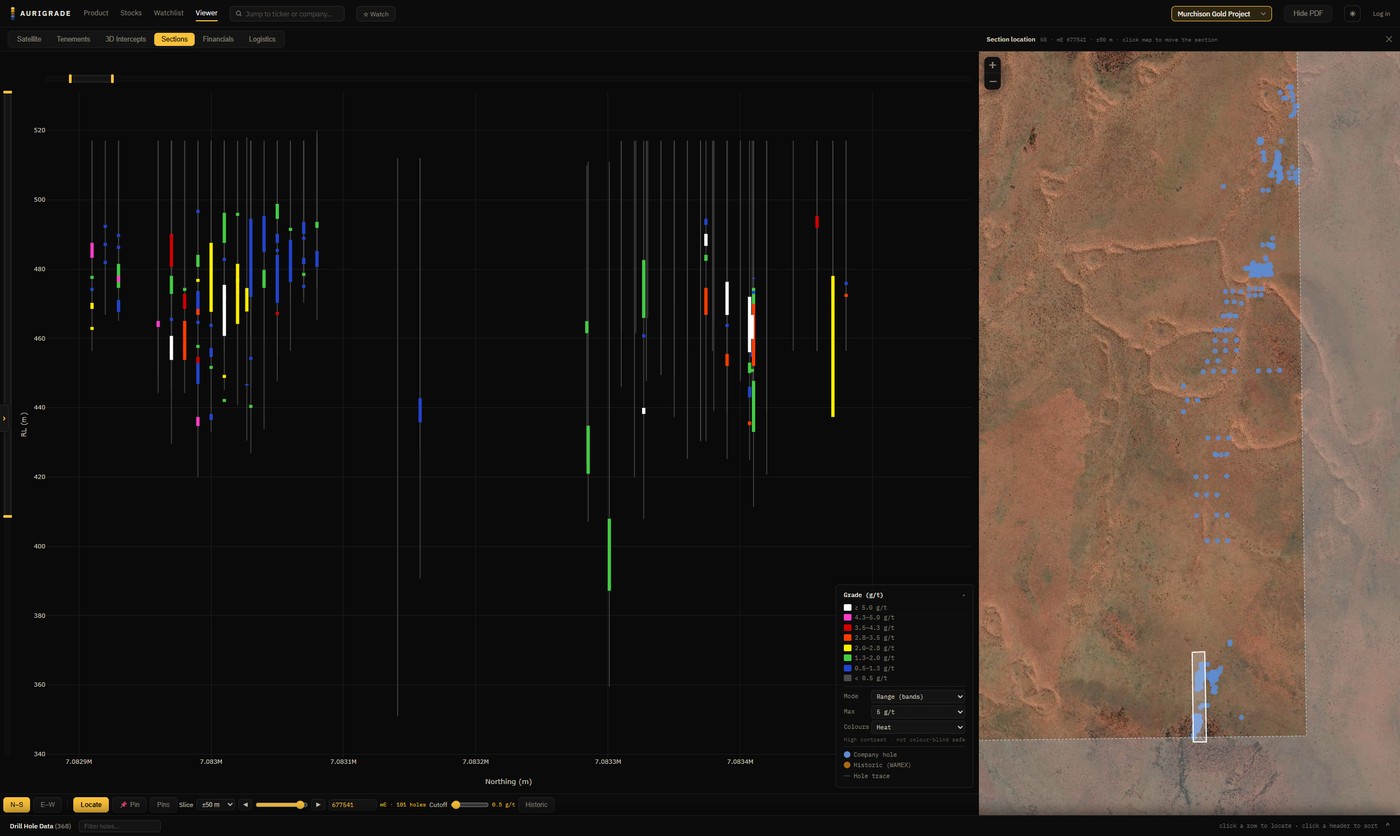
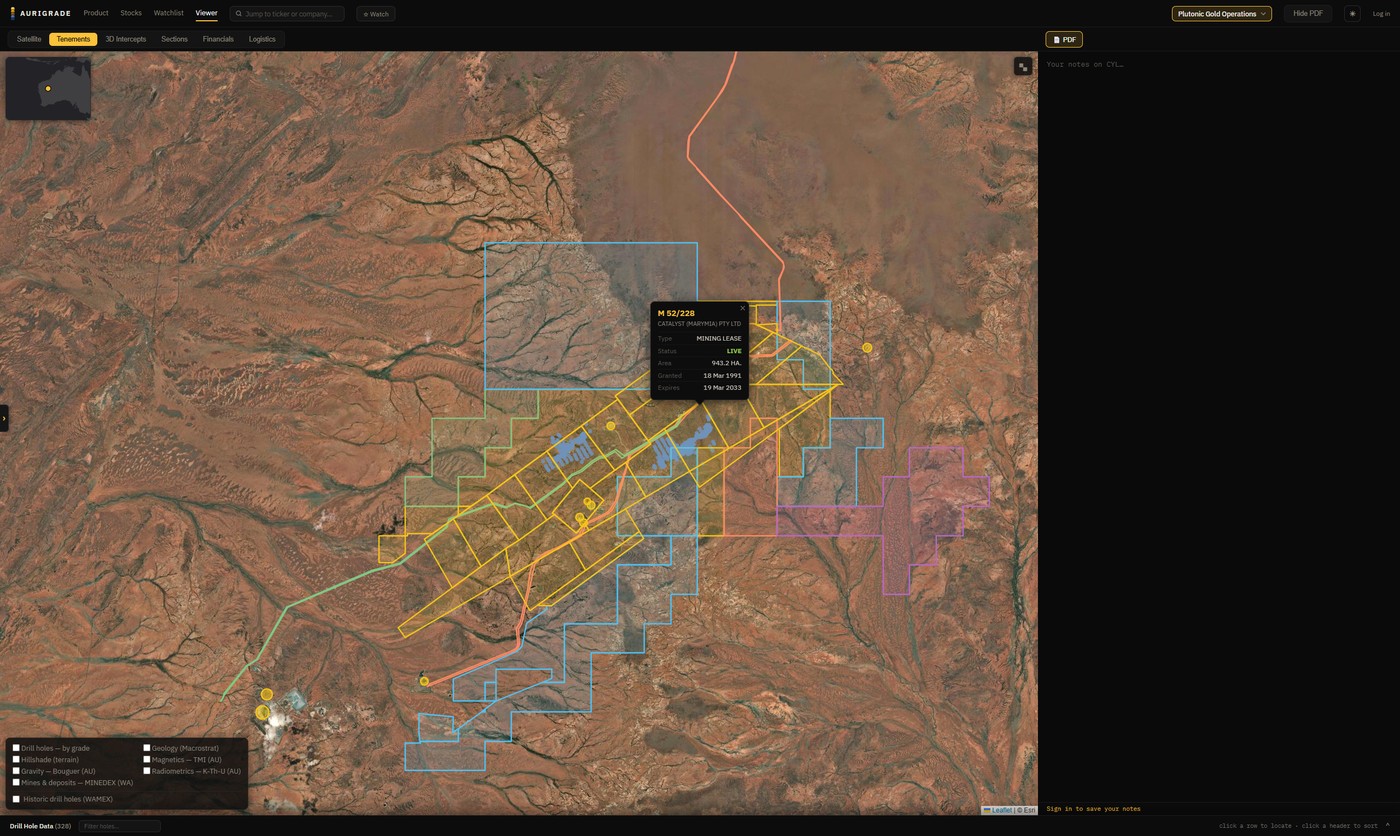
Who holds the ground — straight from the registries
Live tenement boundaries from the state registries, drawn over satellite — click any parcel for its holder, status, grant and expiry. A built-in notepad keeps your own working notes beside each company.
See the tenements →